 Breaking down some WTA stats and percentages
In this article I will focus on the women’s game (WTA) as. from a trading perspective, it tends to give us more options and opportunities, writes Dave Renham. Specifically, I am going to look at different game scorelines from over 1000 WTA matches and break down the percentage chances for both the server and the returner on certain scorelines. The data focus on games within the first set up to 6-6. So, let’s crack on.
First point of the game (1st set only)
I have looked at over 9000 individual games within first sets, so this will include data for the first game of the set, the last game of the set (excluding the 13th game / tie break), and anything in between. I’ll start by sharing the percentages in terms of who wins the first point within each game:
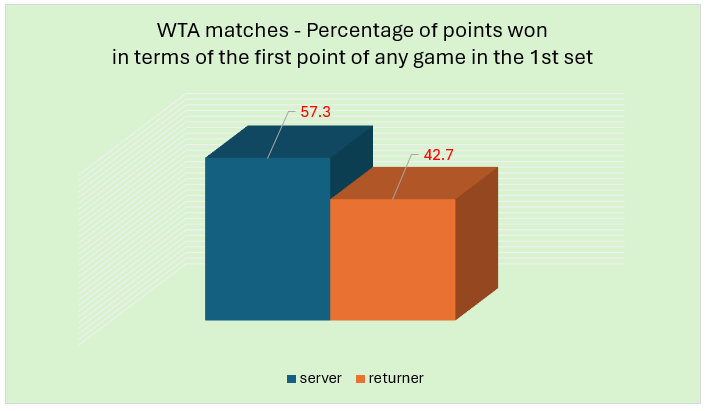
It’s no surprise that the server wins more first points of the game than the receiver and the splits are around what I would expect.
Generally, the percentage of service points won across a whole WTA tour match is around the 57% mark (though it varies from surface to surface) which correlates perfectly. Indeed, looking at the stats for the last 52 weeks for percentage of service points won we can see that the higher the ranking the higher the percentage of winning points. Again, this is hardly ground-breaking stuff, but whenever we look at an average figure like in the graph above, we need to appreciate that most of the top ranked players will be above that figure to some degree and lower ranked players below it.
Sticking with these stats for the last 52 weeks, here are the splits for percentage of service points won by ranking. I have combined rankings thus: 1 to 10, 11 to 20, 21 to 30, 31 to 40, 41 to 50 and 51 to 100.
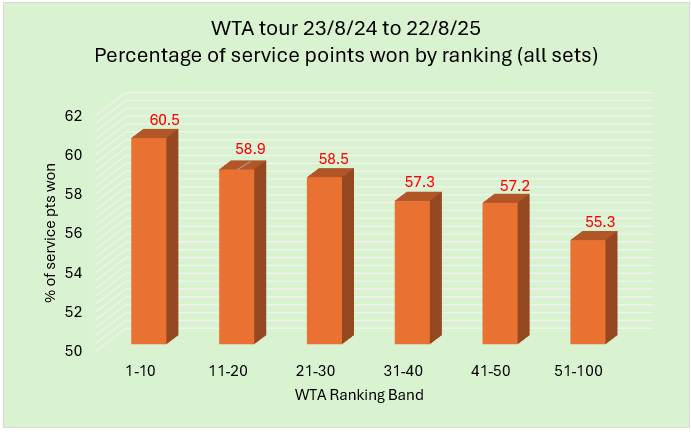
We see the expected sloping scale from left to right with the top ten players averaging just over 60%. Tenth ranked Elena Rybakina, a former Wimbledon champion who peaked at number 3 in the world back in June 2023, has the highest percentage of service points won at 63.9%. She is, then, arguably the player with the most potent first serve. Another strong server, Naomi Osaka, a four-time slam winner who has started to show better form over the past few months, lies second on 63%, with world number 2 Iga Swiatek third on 62.2%.
A couple of top 30 players worth noting who have poor numbers in terms of percentage of service points won are Daria Kasatkina ranked 17 (54.7%), and former French Open winner Jelena Ostapenko, ranked 27 with a win rate of 55.1%. Kasatkina has a weak serve, both first and second, while Ostapenko really struggles on second serve.
To give some Ostapenko context, there was a match played by her back on 30th December 2024 in Brisbane against Marie Bouzkova where she lost narrowly 7-6, 6-4. However, her second serve points win percentage for the whole match was just 16%! The average figure for top 50 players is around 46%. How she managed to keep the match so close with those second serve stats is somewhat remarkable. If you ever trade an Ostapenko match there are times when her second serve goes ‘awol’. When it does, there should be good opportunities to lay her.
Percentage Chance of Winning the game after the first point
Now I want to look at the percentage chance of winning the game after the first point has been played (still focusing on the first set). Ultimately, we can only have two scores at this point, 15-0, when the server has won the first point, and 0-15, when the returner has won the first point. Clearly, we would be expecting a 15-0 scoreline to give the server much more chance of winning the game than if it was 0-15. But how big is the difference? The table below shows the splits:
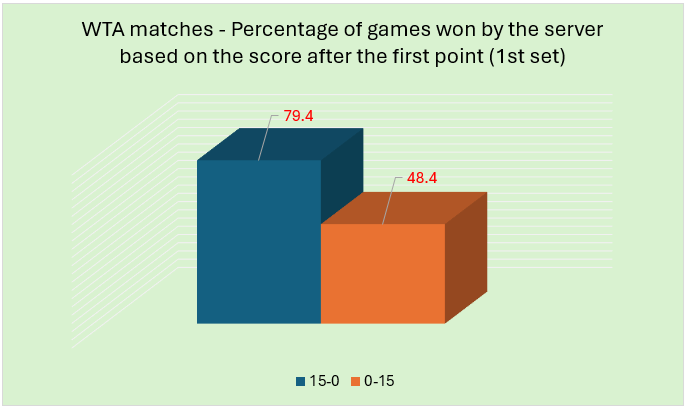
The difference in percentage terms is around 30%. Roughly four of every five games with a 15-0 scoreline will end up with the server holding serve and taking the game. That drops to just under one in two if the returner takes the first point giving us a 0-15 scoreline. Whenever we are thinking about an entry point after the first point of a game has been played, we need to have an understanding of these percentages.
Again, I must reiterate that these are averages. If, for example, we look at the recent stats for Iga Swiatek over the past five tournaments (French Open, Bad Homburg, Wimbledon, Montreal, Cincinnati), her game win percentage across first sets when leading 15-0 stands at a mighty 93%, from 0-15 it is still well above the norm at 70.5%.
It should be stressed that the sample is relatively modest (116 service games analysed in total) and that she is probably the current form player of the WTA having won two of those tournaments, finishing runner up in another, and a semi-finalist in yet another. However, it highlights that knowing individual stats for individual players can really give us an edge.
Percentage Chance of Winning the game after the second point
Once we get to two points played, there are three potential scorelines of 30-0, 15-15 or 0-30. Let’s start by seeing how often each once occurs:
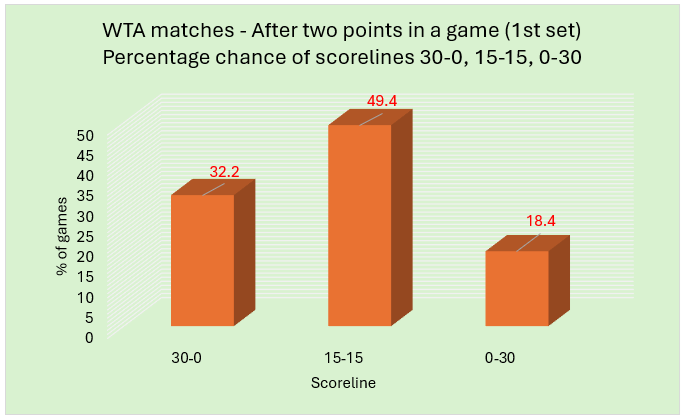
Roughly 50% of WTA matches have a 15-15 scoreline after two points. Around a third of matches see a dominant scoreline for the server of 30-0, while just under a fifth of matches see a 0-30 score.
From a maths point of view, we can use combined probability theory to see what these ‘2-points played’ percentages should be based on the earlier WTA info shared where the server wins 57% of points and the returner 43%. Below is a table showing the mathematical calculations. (S stands for server winning the point; R for returner winning the point):

As there are two ways of getting to 15-15, we need to add the two percentage chances up (2.451+24.51) to give us 49.02%. As can be seen, when the first points of a game have played out in reality, the percentages are very close to those expected using probability theory:

As a mathematician, seeing theory matching well with actual data is no shock, but it helps cement our confidence in the percentages the data is showing us.
Now, let’s review the percentage chance of each player winning the game from the three scorelines.
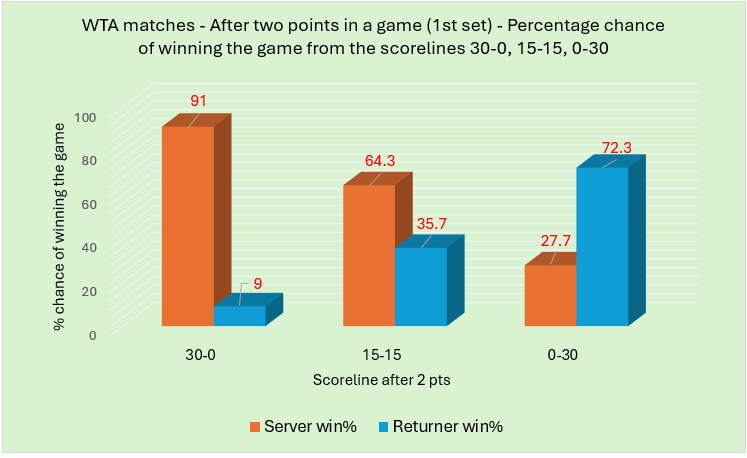
91% of servers go on to win the game when leading 30-0, and 72% of returners win the game from 0-30. The 15-15 scoreline may look slightly out of kilter at first glance. Knowing that 57% of points are won by server, then you may think 64.3% is higher than it should be. However, one stat I have yet to share is that around 64% of all service games end up with a hold of serve. So essentially, the 15-15 scoreline does not really change anything and the percentage chance for the server and returner of eventually winning the game remains the same as it did when the game started at love-all (0-0).
I mentioned earlier that having a good understanding of the percentages at a given time in a game will help us as traders in terms of deciding upon entry and exit points. Again, I make no apology for restating that the percentages shared are average figures for all WTA players. However, it gives us an excellent baseline from which to work from.
Percentage Chance of Winning the game after the third point
Once three points in a game are played, we have a situation where four scorelines are possible. 40-0, 30-15, 15-30 and 0-40. Below is a table showing the percentage chance of each scoreline occurring (column 2) and also the % chance of the server (column 3) or returner (column 4) going on to win the game:

The 30-15 scoreline occurs most often, again most tennis traders would have expected this. But the data again will help us when determining trading strategy if we choose to enter or exit at this point within a game.
Pressure Points
Not all points within a game have the same importance. Pressure is a key factor in tennis matches – how each player handles it is hugely significant. Generally, the player who copes with the pressure best tends to win.
There are scorelines within games where there is more pressure, usually described as ‘pressure points’. These refer to moments when the server faces a real threat of losing their serve. This includes defending break points, as well as moments where losing the next point would see the server having to defend a break point.
WTA data on three of those scorelines 0-30, 15-30 and 0-40 has already been shared. I want to finish this piece by looking at the rest. There are five remaining pressure points, coming at 30-30, 15-40, 30-40, 40-40 (deuce), 40-A.
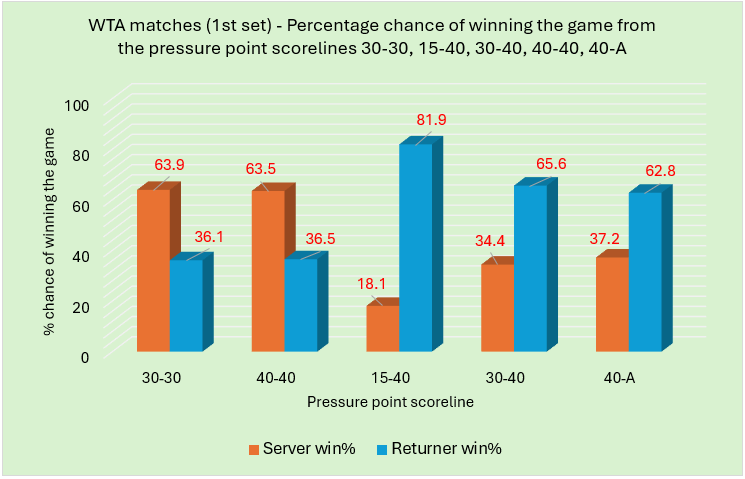
The percentages for 30-30 and 40-40 are virtually the same. This is to be expected as essentially, they are the same scoreline; each player is a minimum of two points away from winning the game at both of these scorelines. These percentages are also very similar to the 15-15 ones.
As regards 15-40, the server has a poor chance of holding serve at just over 18%.
At 30-40 the server has a better chance of holding serve than at 15-40 but it is still only around one game in every three that this will be achieved.
At 40-A the stats suggest the server has a slightly worse chance of winning the game compared with at 30-40, but I wonder if this may be partly down to a smaller sample size compared with all the other scorelines. Having said that the 40-A scoreline appeared 1164 times in my sample, so it’s still a decent number of points played. Maybe the server feels more pressure once the game is at deuce and beyond in a game.
Of course, there is more to successful trading than simply knowing the game score percentages. However, the better we know the numbers the better we are likely to trade long term. Combining an understanding of key percentages with how the market is likely to move / react is crucial.
I’ll be back in a few weeks, when the Asian swing will be upon us, with another article. Until then, thanks for reading, and trade well…
– DR
p.s. It’s not too late to join us for the US Open. The first round is well underway and there’s stacks of great betting and trading opportunities to come over the next fortnight and beyond. Click the image below to get started 👇


