
 The ATP Tour: a look at the current top ten players
In my last article I discussed ‘Pressure Points’ on the WTA and looked at percentage chances of winning the game from certain scorelines in the first set of matches, writes Dave Renham. If you missed it, you can read that here.
Those percentages were based on averages across all WTA tour matches. For the first part of this article, I am going to revisit Pressure Points but on the men’s main (ATP) tour. Pressure points refer to points in a service game when the server faces the imminent danger of losing their serve. This includes defending breakpoints, as well as situations where losing the next point would put them in a breakpoint scenario. Hence the following eight scores count as pressure points: 0-30, 15-30, 30-30, 0-40, 15-40, 30-40, 40-40 and 40-A.
Overall ATP Pressure Point performance
Below is a graph showing the average percentage chance of a server in an ATP match going on to win their service game from these given scores. It covers all players on the ATP tour.
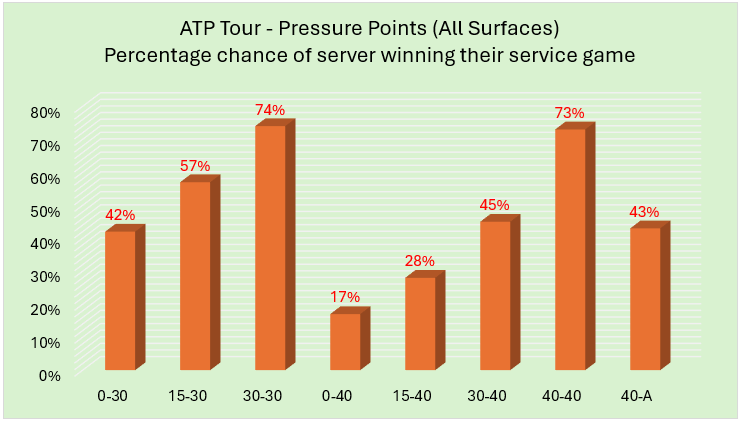
Compared with when I looked at the same score scenarios on the WTA tour, we can see the percentage chance of the ATP top ten player serve prevailing is much higher for each individual scoreline. This is obviously down to the fact ATP players have stronger serves and win a higher percentage of points on their serve compared with WTA players. Of course, these are ‘overall’ average figures covering all ATP matches, so keep that in mind when making trading decisions at certain scorelines.
Coping with pressure: Overall
One thing that separates great players from good players is their ability to cope with pressure. When we look at overall stats for example, we see that in his career Novak Djokovic has won 54.5% of all points, Roger Federer had a similar career figure of 54.2%, while Rafael Nadal won 54.6%. Hence, even the greatest of all time were not completing dominating in terms of points won. What the greats do better than pretty much everybody else is win more key and pressure points.
In terms of the current top 10, how have those players fared across all the pressure points they faced on serve in the past 52 weeks? Below are the splits for not just all matches, but also split by surface (players ordered by ATP ranking):
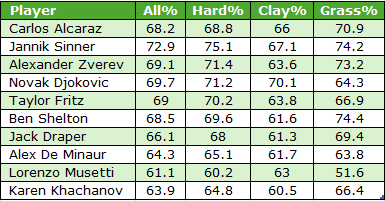
As we can see Jannik Sinner’s performance when serving under pressure has been exceptional. Also, as we would expect, the general pattern in terms of the percentages is trending downwards as we move down the top 10 ranked players. As a comparison, of the players currently ranked 101 to 110, five of them had ‘All%’ figures under 60%.
It is also important to note that players have a higher win percentage on grass compared to hard courts, which in turn is higher than the clay percentages. This is down to speed of surface, and when trading matches we need to know the slight changes in these percentages in terms of the surface, as again this will impact our decisions.
So, how do the top ten stack up when we compare their win percentage on serve for pressure points versus non-pressure points? [Non-pressure points are 0-0, 15-0, 30-0, 40-0, 40-15, 40-30, 30-15, A-40].
Let’s see (these stats are for all surfaces):
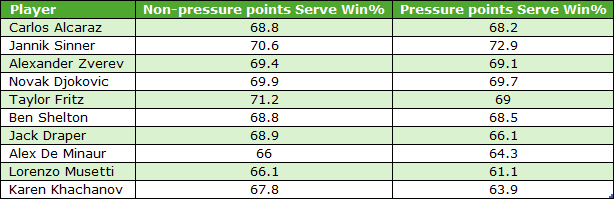
Jannik Sinner bucks the trend as he has a better win percentage when tackling pressure points compared with non-pressure points. He really is the ice man! The rest have performed slightly better when there has been less pressure on the point.
Now let’s look at the presure ratios (Pressure Points% divided by non-pressure points%) for each player. Graphing it shows a clear pattern:
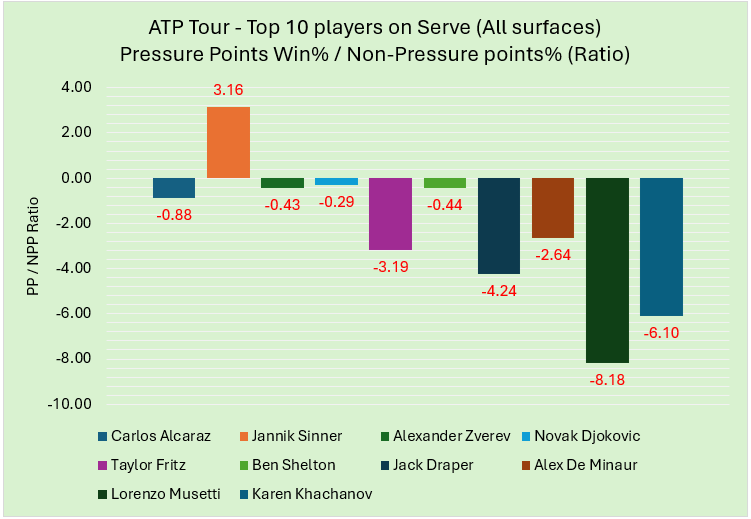
The graph is ordered such that the highest ranked player, Carlos Alcaraz, is on the far left of the graph, moving from left to right down the rankings until we reach the tenth ranked player, Karen Khachanov. The ratios in the graph clearly show a positive correlation between the ranking of the player and his ability to handle pressure points. The top four ranked players have clearly handled the pressure points better than those lower ranked. Ben Shelton, ranked sixth, is also good when dealing with pressure, his strong serve likely pulling him out of some tight spots and improving his ratio. Knowing these nuances will help inform decisions when trading these players in matches.
Out of all the pressure points on serve, it is fairly logical to assume that facing a break point would be the most pressurized. So let me look at the top 10 players and specifically their percentages in terms of saving break points over the past 52 weeks:
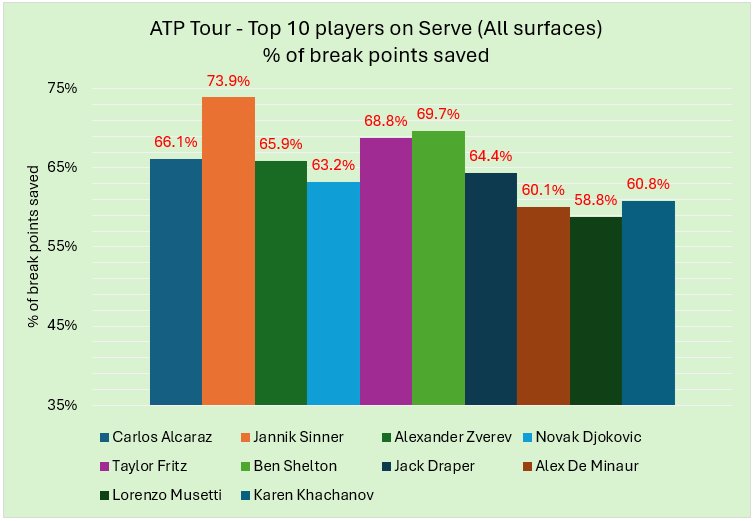
The graph once again tends to slope downwards from left to right, with Sinner naturally the standout. Taylor Fritz and Ben Shelton have two of the best serves in the game so that is why their figures are slightly out of kilter with the rest of the graph. Lorenzo Musetti has the lowest percentage, which correlates with the lowest PP/NPP ratio we saw earlier.
Pressure Points by Surface
We saw earlier when looking at pressure points that the surface makes a difference. The serve in men’s tennis is less potent on clay than it is on a hard court which in turn is less potent than it is on grass, so let me split the break point saved percentages for the top 10 by surface:
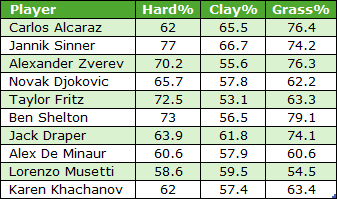
With limited grass data compared to hard and clay data, we need to be slightly careful when looking at those numbers here. Taylor Fritz, for example, has a surprisingly low grass% at 63.3, but if we look at the previous year’s grass data it was 72%. Let me also say that Sinner’s hard-court figure of 77% is exceptional.
If we combine the stats of all players in the top ten, then the percentage of break points saved for hard courts averages to 66.2%, while on clay this drops to 59.6%. Eight of the current top ten players have higher percentages on hard courts compared to clay courts. Alcaraz and Musetti are the two that buck the trend, and both have had excellent clay court seasons in 2025. Alcaraz has lost just once in 23 clay court matches this year, while Musetti is 19 from 23. This helps explain their better clay court break point saving percentages.
Return of Serve
Of course, serving is just one part of the tennis puzzle, so let me look now at some data for the top ten players when returning serve. I’ll start with percentage of return points won:
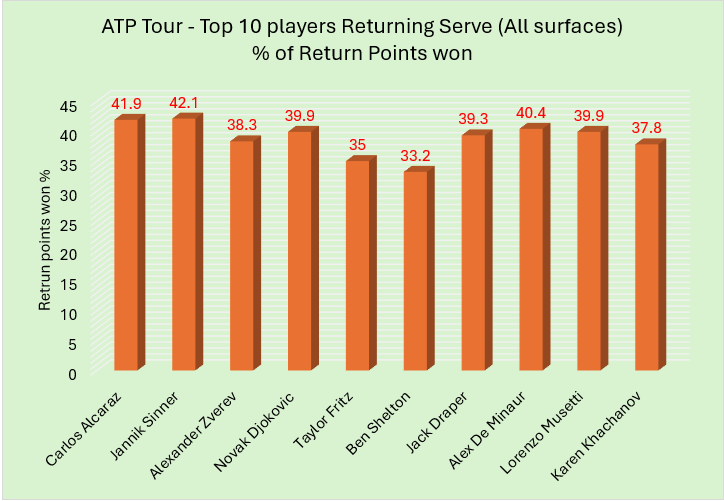
With men’s serves hard to break (the top 50 hold serve on average 83% of the time; the top ten hold around 87% of the time), being able to break is crucial so the more points that can be won on return the greater the chance of breaking serve.
Break of Serve
In terms of actually breaking serve, how do their figures stack up? Let’s see:
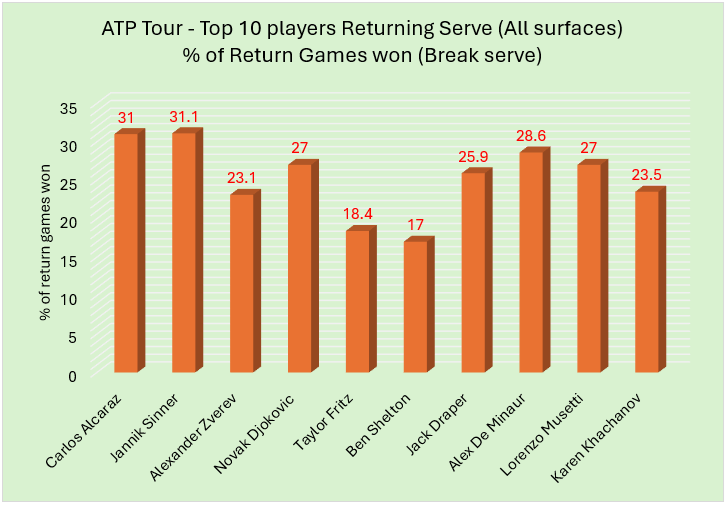
The top two players in the world, Carlos Alcaraz and Jannik Sinner, are well clear of the rest here, and this is probably the biggest reason why the pair have separated themselves from the pack in the last two years. The top 50 average ‘break of serve’ figure is down at 21% which again helps to show perhaps why most of these players have been so successful. Eight of the ten are above that 21% average; only Shelton and Fritz have figures below, and their strength lies in their serve rather than their return game as we saw in the earlier serving graphs and tables: if you win all your service games you only need to break once per set!
Break of Serve by Surface
The break of serve percentages above are averages across all surfaces, and here are the surface splits for each:
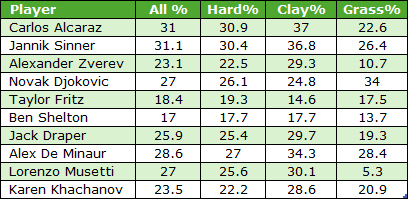
We would expect more breaks on clay courts so that is why these percentages are generally the highest. Likewise, the grass figures are the lowest. It should be noted that Musetti’s grass figure is based on just one grass match over the past year in which he was struggling with a leg injury, so we should just ignore it. For the record, Musetti’s break percentage on grass across the previous 52 weeks stood at 20.7%.
On clay we can see that Alcaraz and Sinner have broken 37 and 36.8% of the time respectively, well clear of the rest, perhaps with the exception of Alex de Minaur on 34.3%. Their amazing French Open final demonstrated how much better than the rest that duo are on this slower surface. Both players though, in terms of breaking serve on clay, have some way to go to match the King of Clay, Rafael Nadal, whose break percentage on the red surface across his whole career was an amazing 42.6%!
**
Summary
Knowing the long-term percentages for players across key metrics can help inform our trading choices, because there are some stark differences from player to player. For example, in the final table above, which contains break of serve percentages, we can see that on grass this year Novak Djokovic has broken serve around three times more often than Alexander Zverev (34% versus 10.7%). And this is not even peak Djokovic!
It is interesting to see the differences in strengths and to a lesser extent weaknesses when comparing the top ten players in the world. Zverev, Fritz and Shelton are what might be called serve-biased players. Their serving stats are far stronger than their returning ones. Meanwhile Sinner is just as strong whether serving or returning. Alcaraz’s return stats are currently slightly better than his serving ones but, having seen his serve improvement in the US Open a few weeks ago, I am expecting those figures to start to creep up further in the coming months.
I hope this article has given some key insights into the top ten men currently and good luck when trading the Asian swing.
– DR